
Top 10 Javascript Chart Libraries
13/06/2019 . 11 minutes, 2 seconds to read . Posted by Admin#WebDevelopment #Javascript #Jquery #fetchdata #PHPCodigniter #codeignitertutorial #learnphp
What is Javascript?
Javascript is a programming language to use in HTML pages to make them more adorable and stylish with advanced visual and dynamic effect. By using animation properties of CSS3 the developers take the designing to another level but the javascript makes it ridiculously easy and more reliable to use. It is a famous and the crown prince of front end scripting. It is provided countless functionalities of animation with calculation.
Javascript Charts Libraries
In this article, we're here to discuss some of the best javascript charting libraries to establish/develop tables, data charts, graphs and many other awesome effects through javascript to make beautiful and dynamic charts and graphs. By this way, the developers will be looking forward to making the look of the website more attractive and appealing but calculative and judgemental look.
Here is the list of some popular and adapted libraries of charting in javascript.
-
Data-Driven Documents – D3.js
-
Google Charts
-
Chart.js
-
Chartist.js
-
Sigma js
-
n3 Charts
-
HighCharts JS
-
FusionCharts
-
Flot
-
Pizza Pie Charts
1. D3.js (Data-Driven Documents ):

The first choice that hit to the developer’s mind while thinking of charting is D3.js Library of Charting in JavaScript. The D3.js has rich, generous and stunning features. Its unique features like entering and exit, syntax similarity, powerful transition effects and more.
Syntax familiarity with jQuery is the key and one of the leading JavaScript Charting Libraries. If you want to hitch charts on your web, you can simply achieve it using HTML, CSS and SVG. They used the DOM [Document Object Model] to convert or transform data into a visual representation. It is one of the widely used charting libraries by designers and developers all over the world. Before using n the D3.js, make sure that your server is latest enough to support this library and all of its features as it does not support the older browsers like IE8. To avoid any trouble about the compatibility, make sure you had the suitable plugin for the system. Uber, Weather.com and NYTimes are some of the sites which have been used this approach to their web developing. D3.js is easy to debug using the in-browser element inspector. It has hundreds of examples for the user to use and understand. Talking about the functions and functionalities, it has curve generating functions. For ease to use it has drag and drop feature.
Pricing
D3.js is an open source and free for all kind of use JavaScript library for charts.
Some Useful Links to Learn D3 JS
2. Google Charts:

It is one of the most common and natural ways to create Charts. It is also for excellent in use for the projects which does not require the complication in customization but prefer simplicity and stability.
These google charts are based on SVG, VML and HTML5. There is a lot of examples/samples and dashboards available to check out. All the provided charts are interactive, and some of them are zoomable or pannable as well. The google charts documentation is very easy and comprehensive to understand. As compared to D3.js these google charts are supportive for old browsers. It has wide support for the user via GitHub, FAQ and forum. Some of the Charts which used Google Charts are Geo Chart, Scatter Chart, Stepped Area Chart, Bubble Chart, Area Chart, Org chart, Treemap, Guage and Timeline.
Pricing
The Google Charts license is free, but the library is not open source. These charts do not allow you to host Google’s JS files on your server, so be careful if you have some kind of sensitive data.
Some Useful Links to Learn Google Charts
3. Chart.js:
The Chart JS is the most common and favourite for developers and web designers. It is one of the most straightforward JavaScript Charting libraries. It provides simple but beautiful chart designs for the users which are mostly web designer.
Like the google charts, It is also compatible for older browsers having versions like IE7 and IE8 as they use a polyfill. These Chart JS are user responsive by default and looks well in tablets and mobiles. In present, Chart.js is widely used by developers and web designers as it is a vibrant open source library. The Chart JS can be used by using HTML5 with the extra added feature of dynamic effects and canvas effects. Its functionality can be increased or extended by using plugins. Documentation is simple and as good as understanding. It has a wide Support via Stack Overflow (A developer friendly site for FAQ). Some of the charts by Chart JS are Bar Charts, Doughnut, Radar Charts, Line Charts, Polar area Charts, Area charts and Scatter Charts.
Pricing
A free open-source Chart JS library. Its License is published/released by MIT.
Some Useful Links to Learn Chart.js
4. Chartist.js:
Chartist JS is similar to Chart JS. it offers adorable and beautiful and user responsive charts. It inherits high priced JavaScript chart libraries properties and it is the product of these libraries as it's developed by the communities to overwhelm/overcome some of the disadvantages of existing libraries.
To use these charts in the project, the developers or the web designer use SVG. It can also be controlled and customized using CSS3, SaaS and media queries. The animation tools of these Chartist JS are compatible with modern browsers as well as old ones and are low in size.
Chartist JS only has 3 chart types: line chart, bar chart, and pie chart. Having great animation and allows using plugins to enhance the functionality of the charts.
Pricing
Open source, free for all kinds of use.
Some Useful Links to Learn Chartist JS
5. FusionCharts:
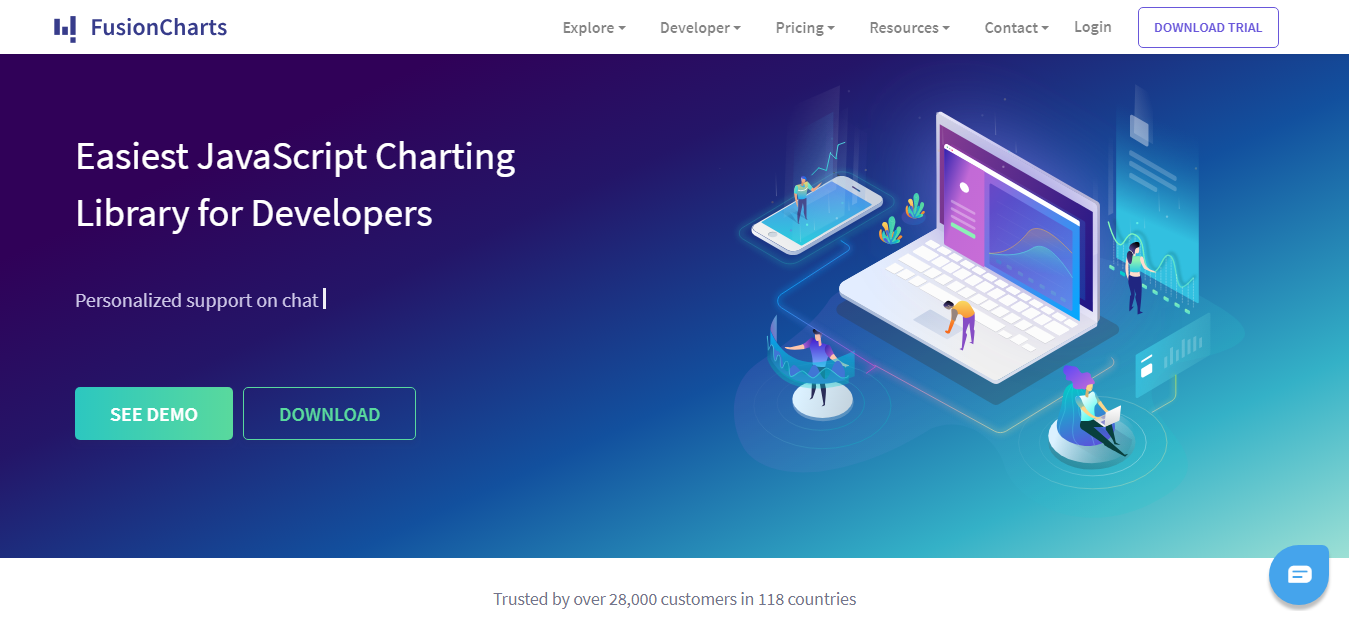
Fusion Charts is one of the oldest JavaScript Charting Library. It was written/developed and released for users in the year 2002. In Fusion Charts charting library illustrated with hundreds of charts which are ready to use.
The charts are used using SVG, HTML5 and VML. Fusion Charts offers better compatibility and can be carried easily and executed on other systems. With the help of XML and JSON languages, the parsing of the data is scrapped easily. These charts can be used or exported into different file formats PNG, PDF and JPG.
Fusion Charts are highly compatible with older browsers like the IE6. Due to the compatibility with the browser's features, it obtained a reputation for a long period and was one of the favourites and preferred choice of developers. It's obtained almost 95 charts and more than1400 maps that implemented for web and mobile applications. The Fusion Charts visualization is animated and made more friendly to use. They are represented using VML and SVG in IE6, IE7 and IE8. The Fusion Charts library includes packages like Powercharts, FusionMaps and FusionWidgets. The new fusion chart library consists of major three themes and also supportive of the spline and spline area while executing composite charts in applications.
Pricing
Free of cost for non-commercial but paid for commercial use.
Some Useful Links to Learn FusionCharts
6. HighCharts JS:

HighCharts is one of the most comprehensive and popular JavaScript chart libraries for developing graphs. It is used HTML5 rendering in VML/SVG. It is light-weighted, supportive for a wide range of various chart types, and make you sure with high performance and satisfaction. one of the most uncomplicated or simple and adaptable API of JavaScript charting available in the market.
Many tools for animation are pre-installed in HighCharts. These tools help a lot of developers to engage people and enhance the look of the application to attract them. Some of the functionalities that are operational and useable are financial charting package, Highstocks and great maps for geo maps. The extra advantage of using HighCharts on your application is because of its compatibility which is highly supportive for old browsers. If you want to implement graphs in official and standard browsers, the developer must use SVG. In the internet-explorer, You have to use VML to draw graphs. Some of them that are pre-installed in HighCharts is Spline graph, Areaspline graph, Column graph\, Pie graph, Scatter graph, Bar graph, Area graph and etc.
Pricing
Free of cost by non-commercial but you have to pay for commercial use.
Some Useful Links to Learn Highcharts
7. AnyChart:

AnyChart is a strong and powerful, light-weighted and rich in features JavaScript chart library with /supplied/provided in SVG/VML. This charting library actually provides web developers with a prominent opportunity to create and use many distinct and different charts which will help them to understand and decide what is seen. AnyChart provides you more than eighty (80) JavaScript chart types which include basic and stock, Gantt and PERT charts and maps. It has numerous ways to set data into the charts like XML, JSON, CSV, JS API, Google Sheets, HTML Table etc. It has simple, rich and comprehensive documentation, API, and friendly support with the FAQ. It can be integrated with various languages like Qlik, Angular, Oracle APEX, Elasticsearch, React, Android, iOS, Vue.js, etc. It is very supportive of a lot of samples and examples. Like most of the other libraries, it also has old browsers support. Its charts can be exported to various formats including JPG, PDF, SVG or PNG images.
Pricing
AnyChart has a watermarked version is free but you have to pay to get rid of the branding and for commercial purpose.
Some Useful Links to Learn AnyChart
8. Flot:
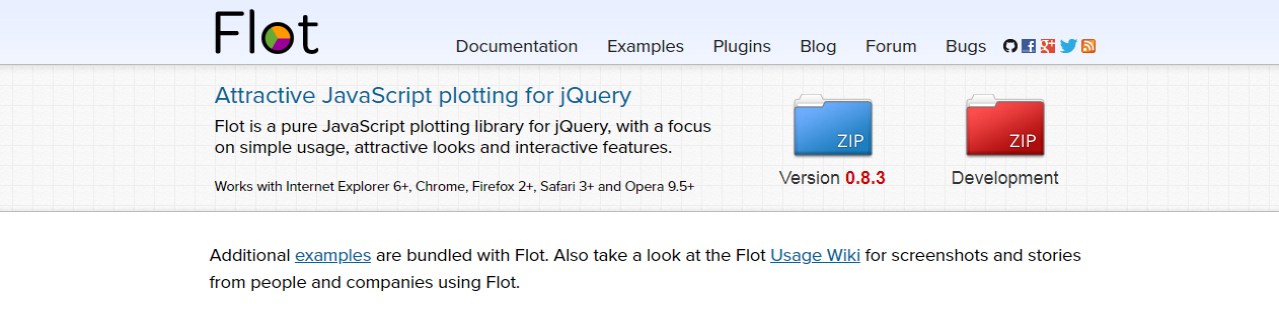
Flot Chart is a JavaScript charting library, especially for jQuery developers. It is observed one of the most popular and oldest JavaScript Charting libraries. Flot Chart mainly advantages to compatibility with older browser versions and even works extremely well with Internet Explorer 6, Firefox 2 etc. As it is compared to other JavaScript charting libraries it is getting old in recent ages but still in the position to check it out.
It is supportive for numerous charts like line, bars, filled areas, pie and a stacked chart. Some of the charts required plugins as stacked chart needed the jquery.flot.stck.js plugin to established and pie chart needs a jquery.flot.pie.js plugin to utilize or use. Due to this problem of external plugins, the latest versions of Flot Charts is updated for all plugins which are being integrated to reduce the external effort of the user. Animated plotting graphs can be built with the help of Flot. Flot is also supportive for zoomable or zooms out functionality to check out more detailed and comprehensive information.
Pricing
It is free for developers for developing and for non-commercial use but you have to request for commercial use.
Some Useful Links to Learn AnyChart
9. Plotly.js:
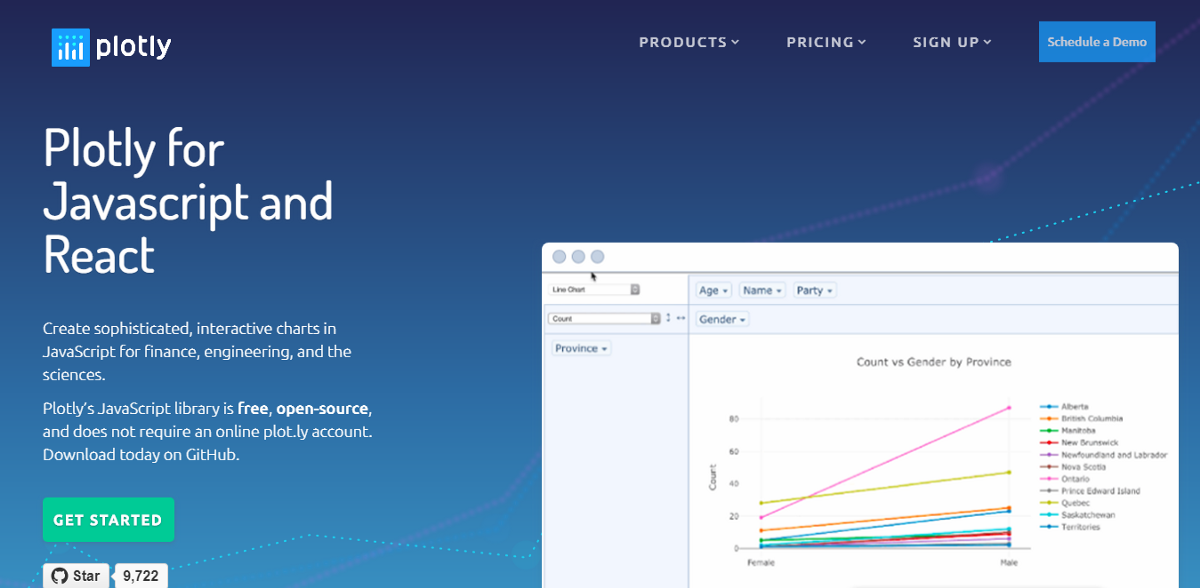
A high-level with multiple choices in charts JavaScript library is Plotly.js which is open-source (means it's free). Plotly.js is built or assembled on WebGL and D3.js, so as mentioned earlier can be used to build/produce many types of different chart which includes also 3D charts to arithmetical or statistical graphs.
In Plotly.js there are more than 20 chart types that can be used or embedded in your web applications or used to design dynamic and effective presentations. It is a browser-based charting library which is used for Python, MATLAB, and R by precis charts to a declarative and explanative JSON structure. Plotly.js has precise and simple and explained API documentation. It has a very adorable animation effect. In Plotly.js exporting of charts is possible with JPGand PNG; SVG, EPS and PDF. There is a lot of examples with different samples to learn and to check it out. It Uses React in JavaScript and also has a support forum.
Pricing
Plotly.js is an Open-source library (means it is free to use).
Some Useful Links to Learn Plotly.js
10. amCharts:
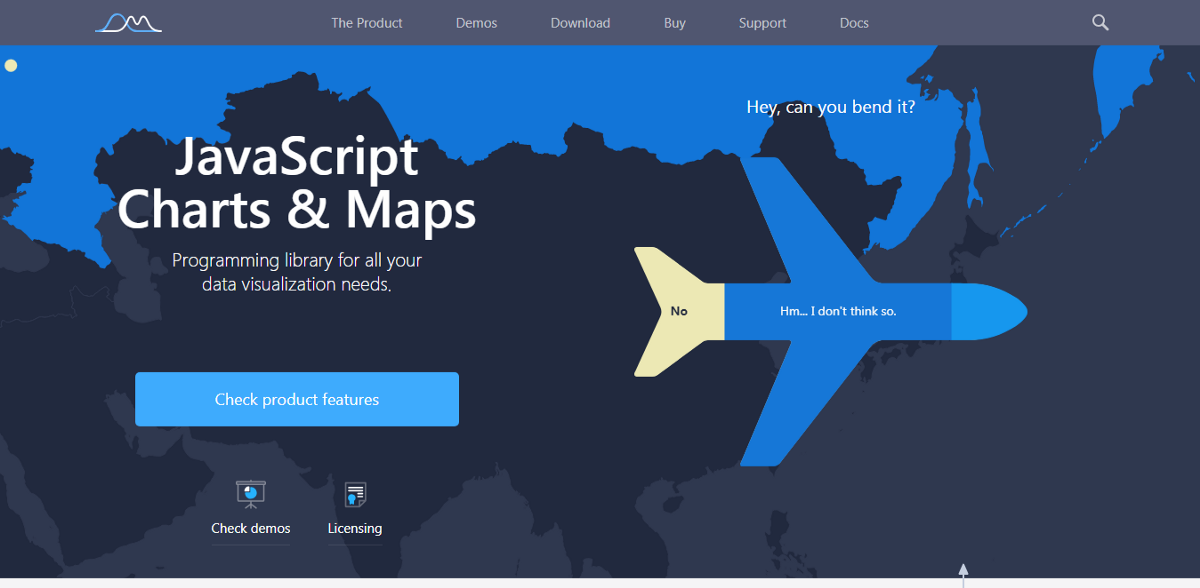
In JavaScript libraries, amCharts is one which is simple but flexible in data representation charting libraries. It is a JavaScript-based chart library which is associated and interactive. It is used to built charts and maps using online editing facility as well as plugins for WordPress developers also.
In amCharts, there is a quite big area of types in charts which includes Gantt and maps charts. You will find it more interactive in options if you drilled it down. Talking about the documentation, it is very well written and explanative as it has all the needed explanation for needed functionalities. It has a stunning and awesome animation in charts. It also has a variety for integration as Can be integrated with Angular, React, Ember, Vue etc. As mentioned above, a plugin for WordPress is also available. One can export it as a PDF file or an image. amCharts has awesome functionality as accessibility functions for W3C-Approval, Full-Customization and Live Charts available.
Pricing
The awesome news is, it is free for any use. Just a tiny link represents the copyright for the brand but if you want to remove it also then you've to purchase the licence.
Some Useful Links to Learn amCharts